Reviewed release 2026-08. Approved by vrraiv on 2026-10-28 (approve with notes); run
20261028T032834Z, git32ec535717b7, data through 2026-08-31.Reviewer's notes: Drift - the CBD was losing trip share throughout 2024, which is complicating the event study design and the synthetic control.
Candidate report, run 20261028T032834Z (2026-10-28T03:28:47+00:00), git 32ec5357,
data 2023-01-01 to 2026-08-31 (44 months).
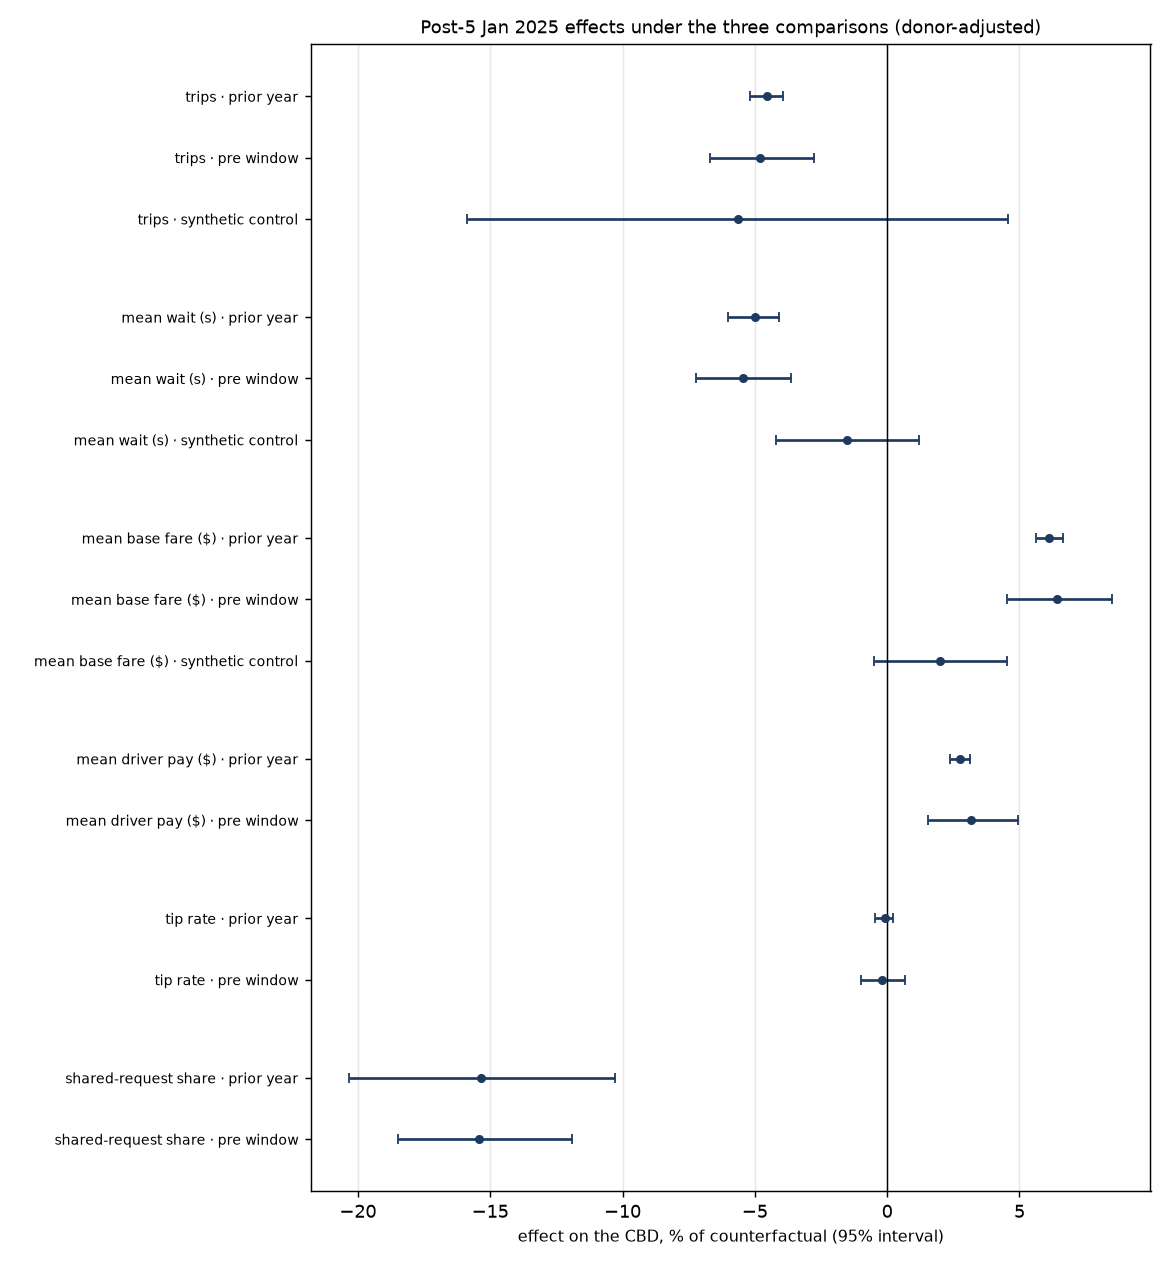
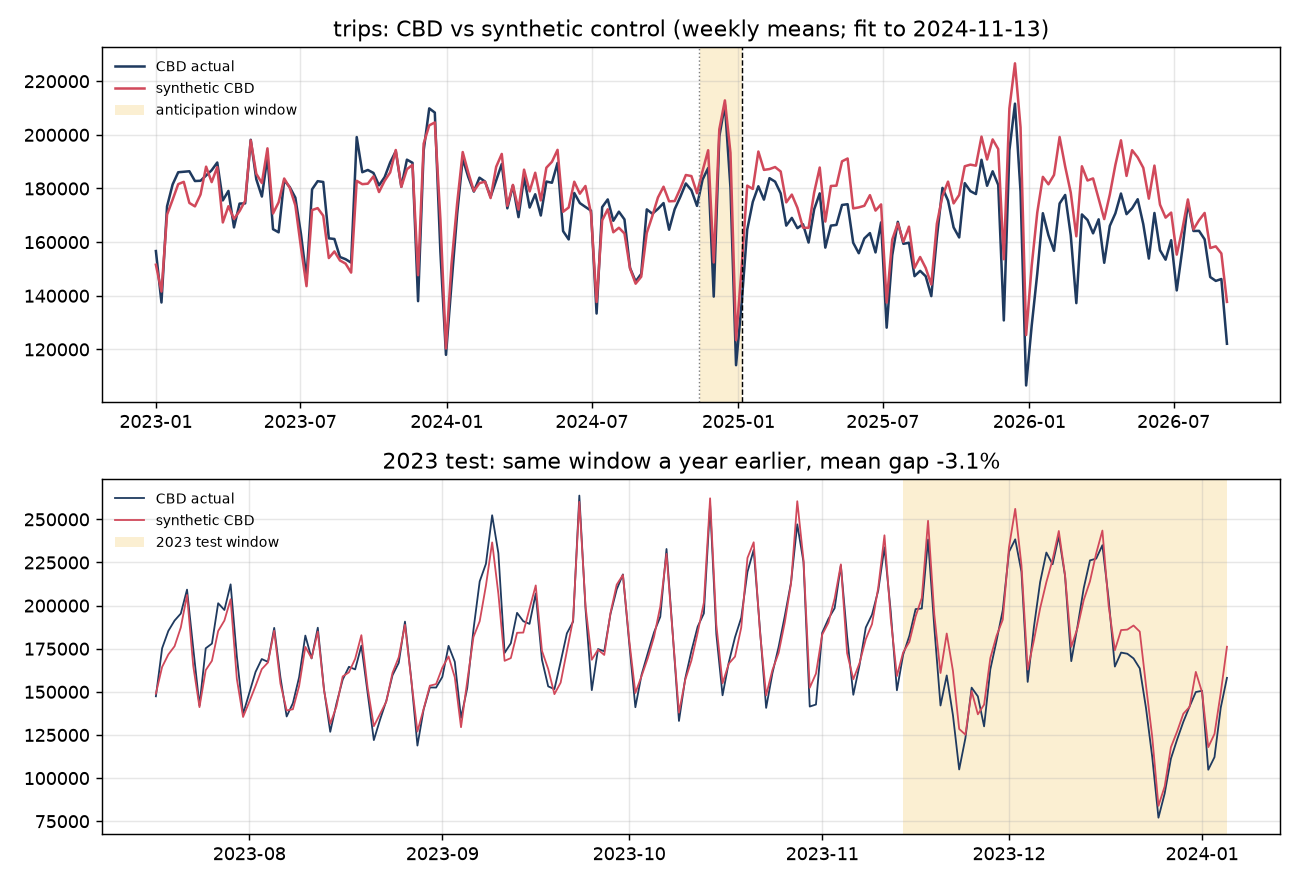
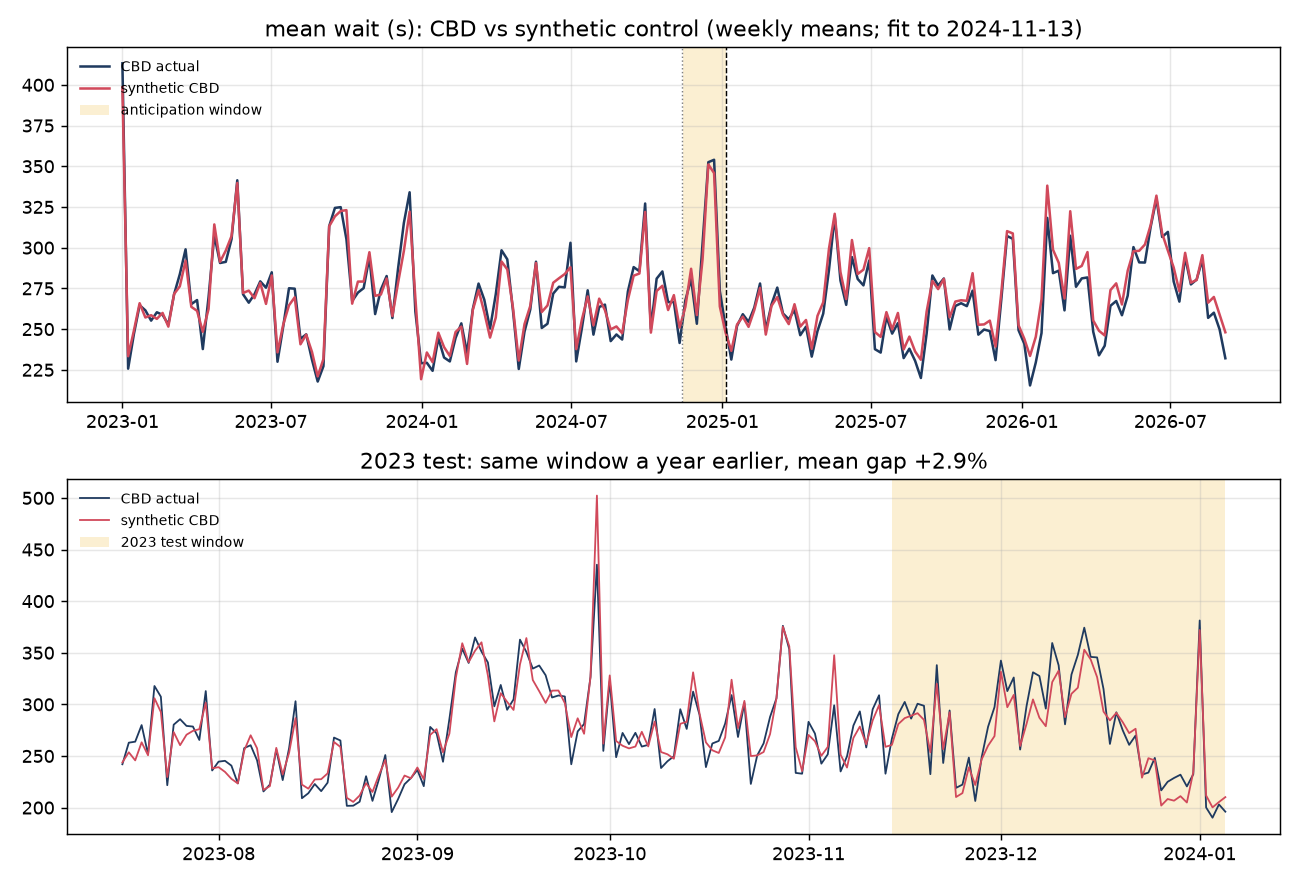
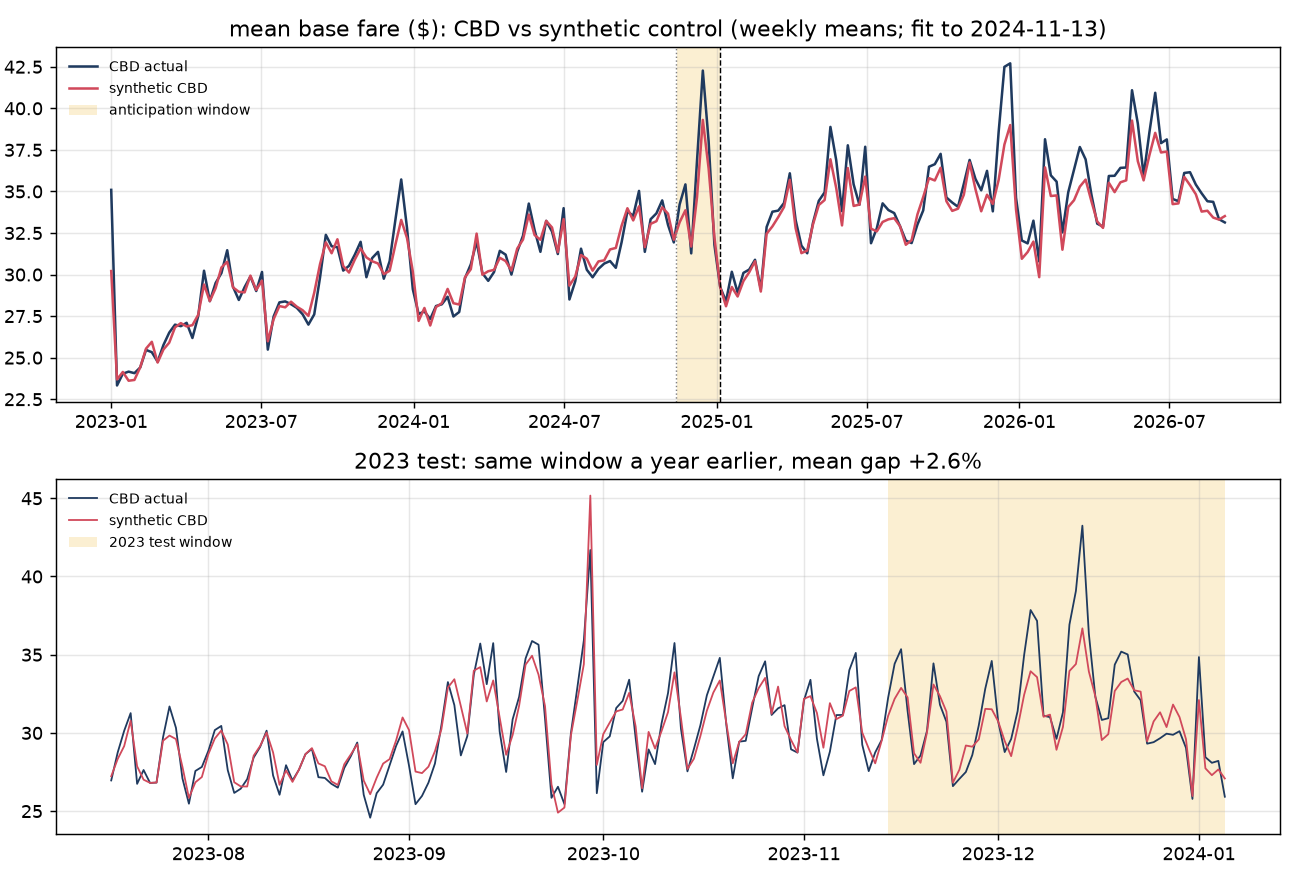
Headline. Relative to the synthetic control, CBD pickups from 2025-01-05 to 2026-01-03 show: trips -5.6% [-15.9, +4.6]; mean wait (s) -1.5% [-4.2, +1.2]; mean base fare ($) +2.0% [-0.5, +4.5] (percent of counterfactual, 95% placebo intervals).
What happened to ride-hail (Uber and Lyft) activity in the Manhattan Central Business District when congestion pricing took effect on 2025-01-05: how many trips started there, how long riders waited, what they paid, what drivers earned? The policy was announced on 2024-11-14, so the weeks in between are treated as a separate anticipation period rather than as clean "before" weeks.
TLC High Volume For-Hire Vehicle trip records, every trip, 2023-01-01 to 2026-08-31. The pipeline streams each monthly file, validates it (schema, row counts, null rates, timestamps, money, zones, licence codes) and reduces it to a pickup zone by hour by company panel; the analyses here start from that panel. Outcomes are daily or weekly ratios of sums, so every number is consistent with every other.
exclude_airport_trips=False).base_passenger_fare, which excludes tolls, taxes, fees and the
congestion fee itself. The fee is tabulated separately in the panel.Three comparisons, all reported (owner design, see METHODS.md):
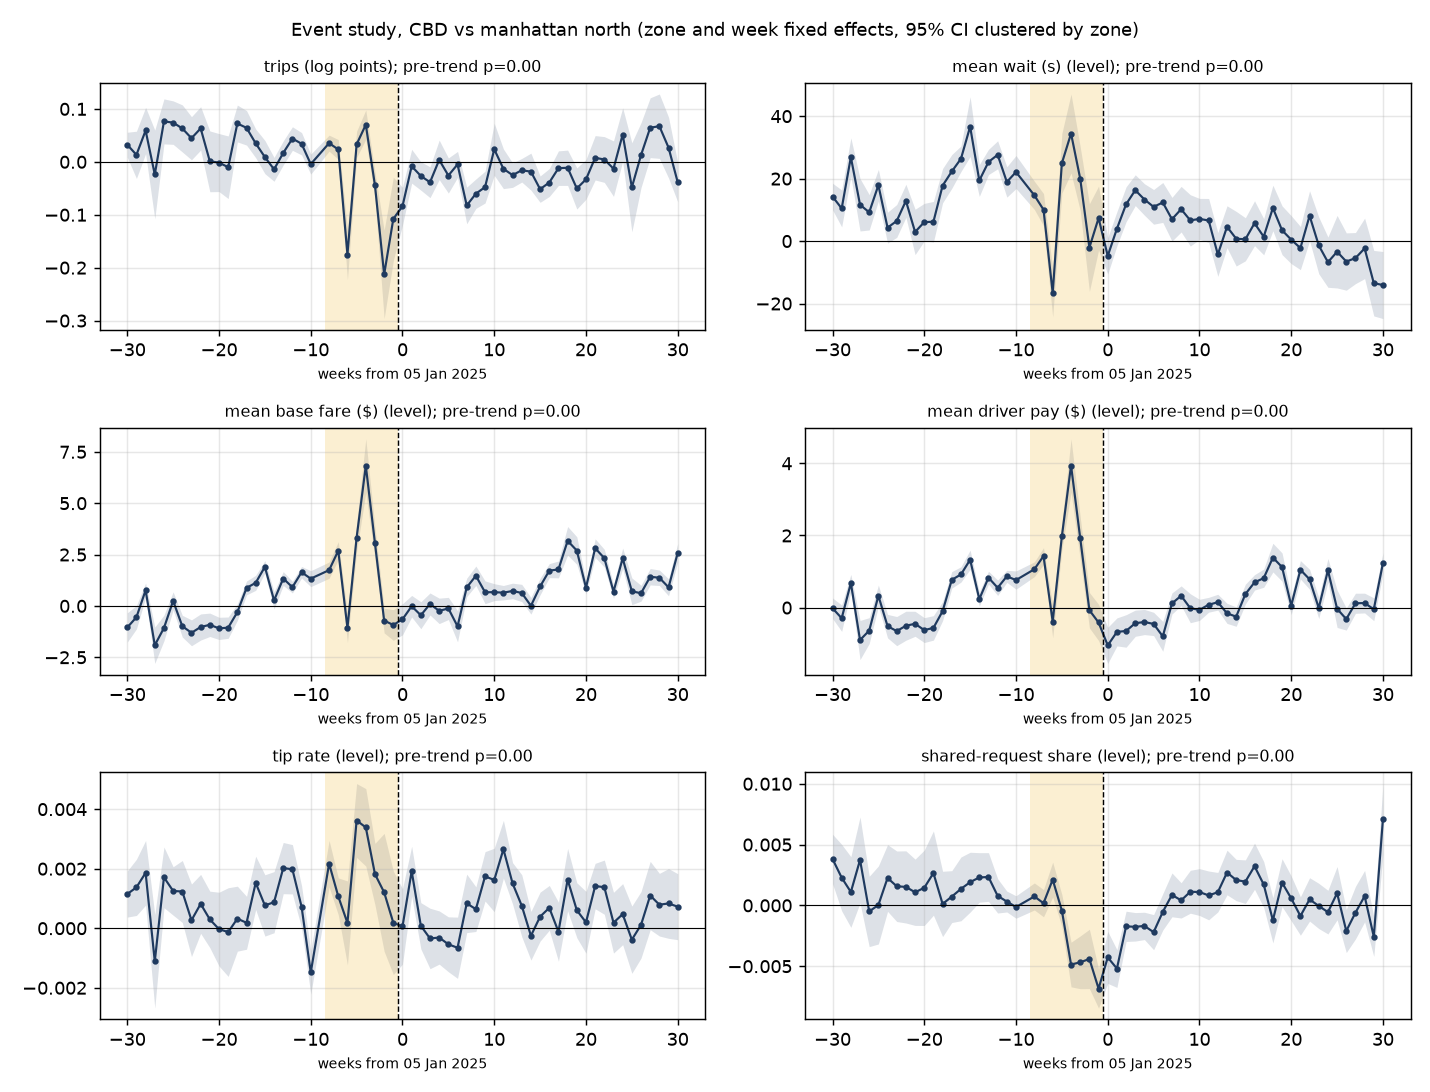
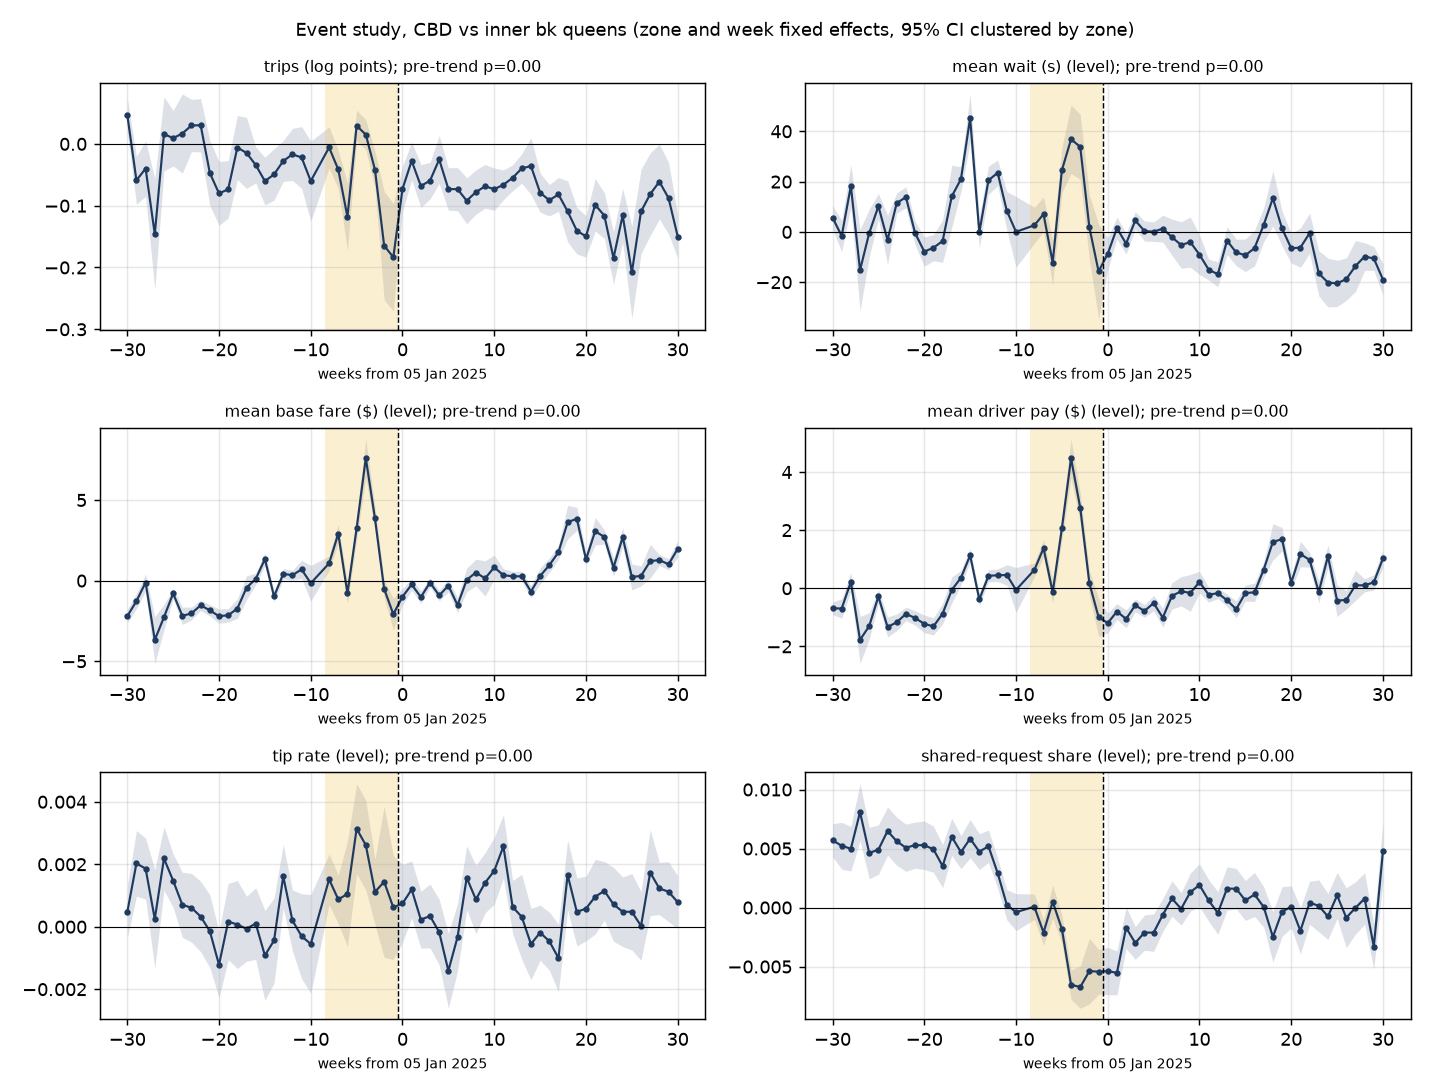
Alongside these, a zone-week two-way fixed-effects event study (zone and week effects, standard errors clustered by zone, 30 leads and 30 lags binned at the ends) against each control group, with a joint test of the clean leads, fake treatment dates in 2024 and fake treated zones as placebos.
The post window for the comparisons is the first 364 days after 2025-01-05 (through 2026-01-03), so that the prior-year design never compares a treated day with another treated day. The event study uses all weeks.
Effects on the CBD as a percent of the counterfactual, donor-adjusted, 95% intervals.
| Outcome | prior year | synthetic control | pre-window |
|---|---|---|---|
| trips | -4.6% [-5.2, -3.9] | -5.6% [-15.9, +4.6] | -4.8% [-6.7, -2.8] |
| mean wait (s) | -5.0% [-6.0, -4.1] | -1.5% [-4.2, +1.2] | -5.4% [-7.2, -3.6] |
| mean base fare ($) | +6.1% [+5.6, +6.6] | +2.0% [-0.5, +4.5] | +6.4% [+4.5, +8.5] |
| mean driver pay ($) | +2.7% [+2.4, +3.1] | n/a | +3.2% [+1.5, +4.9] |
| tip rate | -0.1% [-0.5, +0.2] | n/a | -0.2% [-1.0, +0.7] |
| shared-request share | -15.4% [-20.3, -10.3] | n/a | -15.4% [-18.5, -11.9] |
| Outcome | prior year | synthetic control | pre-window |
|---|---|---|---|
| trips | -4.1% [-8.6, +0.2] | -4.5% [-12.2, +3.1] | -4.0% [-10.0, +1.7] |
| mean wait (s) | -0.9% [-5.2, +2.9] | +1.1% [-3.0, +5.2] | +0.9% [-2.6, +4.8] |
| mean base fare ($) | +5.1% [+2.1, +7.5] | +3.1% [-0.4, +6.6] | +7.3% [+3.0, +12.4] |
| mean driver pay ($) | +2.8% [+0.3, +4.4] | n/a | +6.3% [+3.0, +10.3] |
| tip rate | +0.4% [-1.2, +2.3] | n/a | +0.8% [-1.1, +2.6] |
| shared-request share | -23.0% [-25.8, -19.0] | n/a | -18.6% [-22.8, -14.0] |
| Outcome | Pre-RMSPE | Anticipation gap | Post gap | Placebo p (post) | 2023 test gap | Top donors |
|---|---|---|---|---|---|---|
| trips | 8.17e+03 | -4.5% | -5.6% | 0.10 | -3.1% | Williamsburg (South Side) 0.18, Lenox Hill West 0.18, Upper East Side South 0.18, Lincoln Square East 0.15 |
| mean wait (s) | 13.1 | +1.1% | -1.5% | 0.90 | +2.9% | Upper East Side South 0.48, Lincoln Square West 0.24, Williamsburg (North Side) 0.11, DUMBO/Vinegar Hill 0.09 |
| mean base fare ($) | 1.24 | +3.1% | +2.0% | 0.08 | +2.6% | Upper East Side South 0.73, Lenox Hill East 0.11, Downtown Brooklyn/MetroTech 0.11, Lincoln Square East 0.02 |
| Outcome | Control group | Anticipation | Post | Pre-trend p |
|---|---|---|---|---|
| trips | manhattan north | -0.079 [-0.096, -0.062] log pts | -0.062 [-0.090, -0.034] log pts | 0.00 |
| mean wait (s) | manhattan north | -3.004 [-9.234, +3.227] | -22.701 [-29.666, -15.735] | 0.00 |
| mean base fare ($) | manhattan north | +2.686 [+1.959, +3.413] | +2.825 [+2.082, +3.567] | 0.00 |
| mean driver pay ($) | manhattan north | +1.175 [+0.835, +1.515] | +0.833 [+0.530, +1.135] | 0.00 |
| tip rate | manhattan north | +0.001 [+0.000, +0.001] | -0.000 [-0.001, +0.000] | 0.00 |
| shared-request share | manhattan north | -0.006 [-0.008, -0.003] | +0.001 [-0.001, +0.004] | 0.00 |
| trips | inner bk queens | -0.094 [-0.120, -0.069] log pts | -0.159 [-0.184, -0.133] log pts | 0.00 |
| mean wait (s) | inner bk queens | +3.832 [-3.573, +11.237] | -20.571 [-24.230, -16.913] | 0.00 |
| mean base fare ($) | inner bk queens | +3.853 [+3.292, +4.414] | +3.478 [+2.955, +4.002] | 0.00 |
| mean driver pay ($) | inner bk queens | +1.929 [+1.637, +2.221] | +1.290 [+1.071, +1.508] | 0.00 |
| tip rate | inner bk queens | +0.001 [+0.000, +0.002] | +0.000 [-0.000, +0.001] | 0.00 |
| shared-request share | inner bk queens | -0.009 [-0.010, -0.007] | -0.003 [-0.004, -0.001] | 0.00 |
Requested in the review of the 2026-08 release.
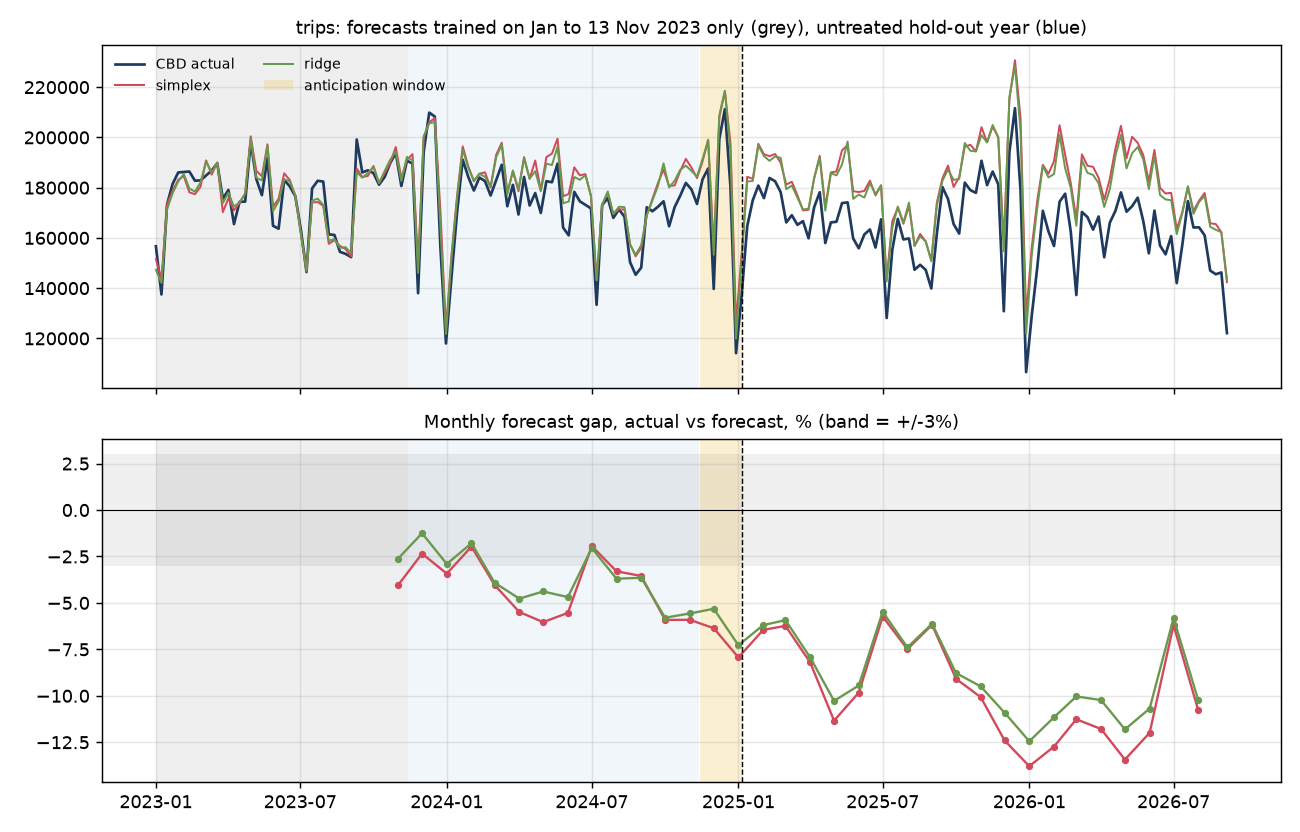
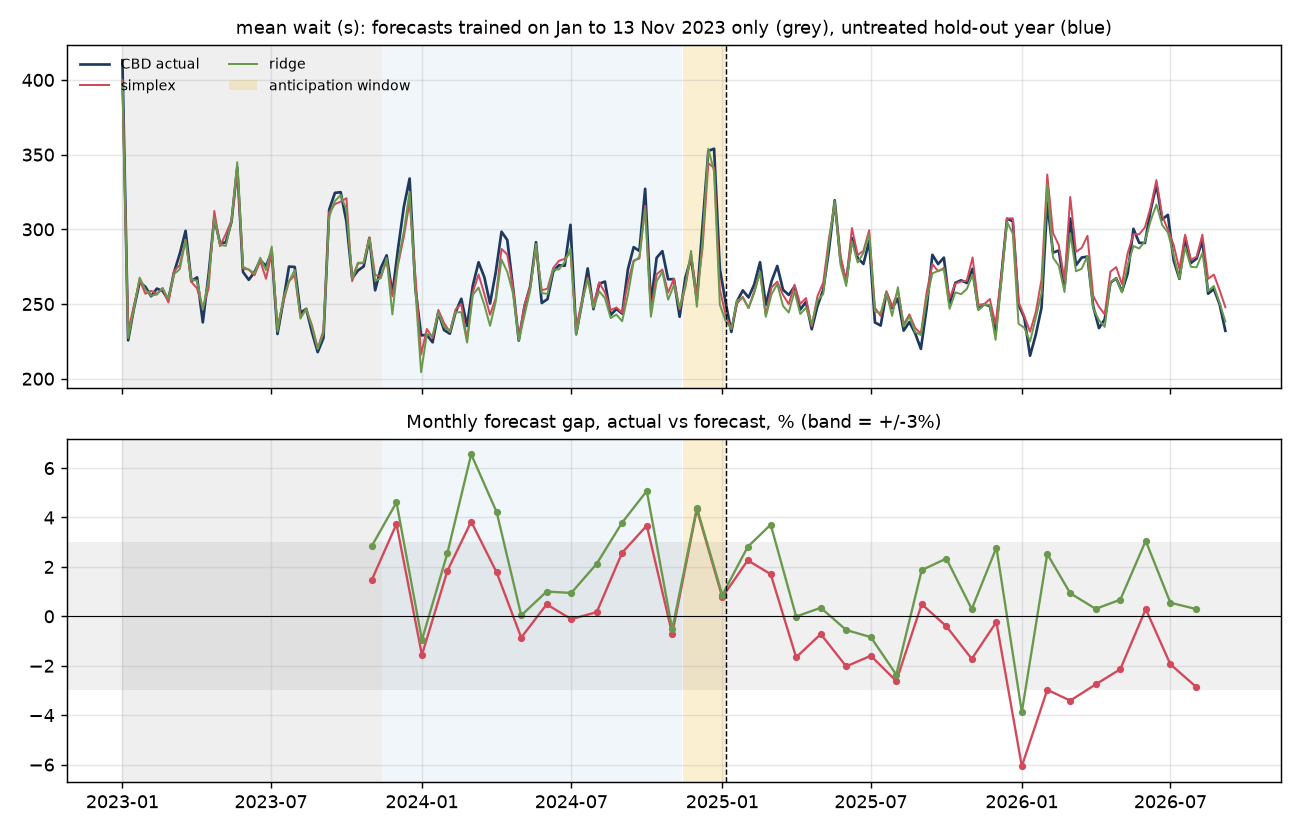
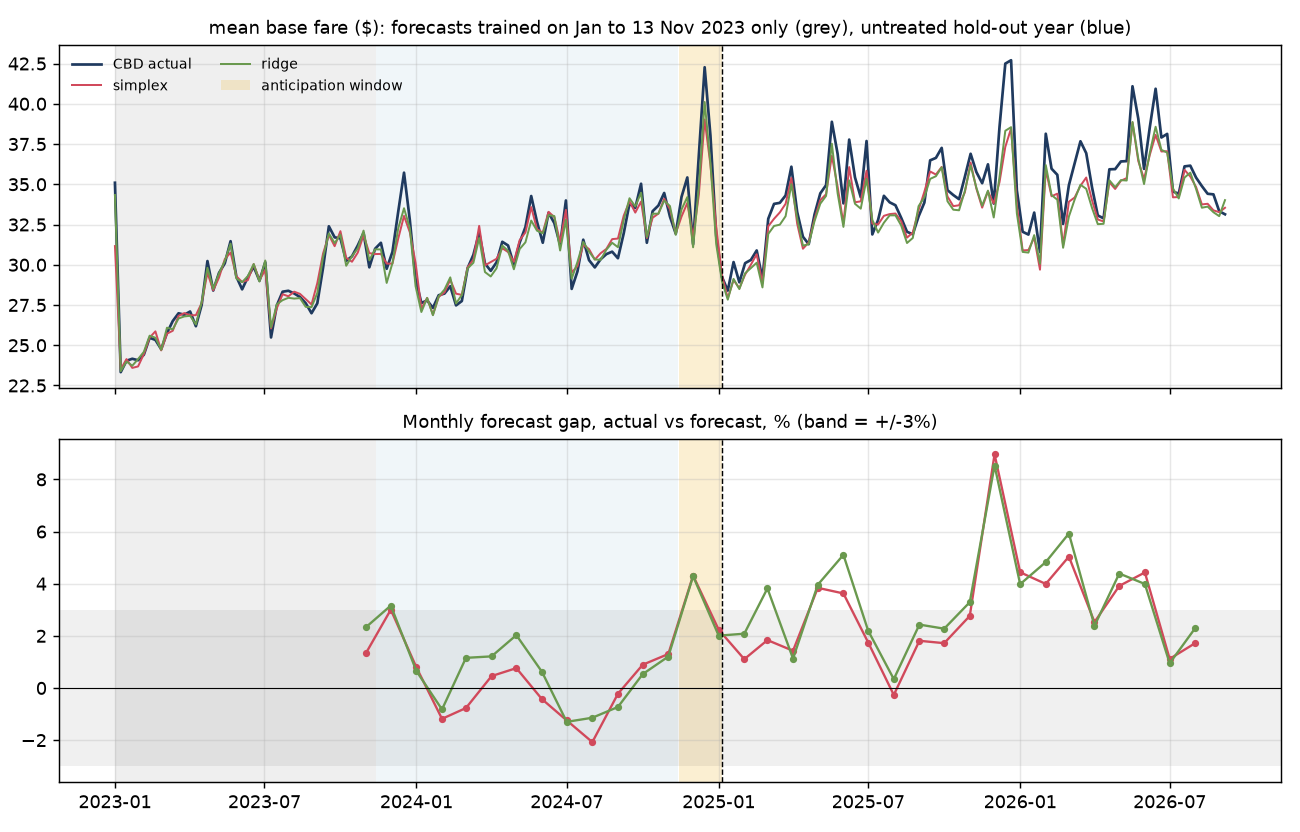
Each model is trained on 2023-01-01 to 2023-11-13 only and then forecasts forward with its parameters frozen. The year from 2023-11-14 to 2024-11-13 is untreated, so a credible counterfactual should stay on the actual CBD series there. Gaps are actual minus forecast, % of forecast. The placebo column is the share of donor zones whose own hold-out drift is at least as large as the CBD's, when each is forecast from the others the same way; a small share means the CBD's drift is unusual, not just noise.
| Outcome | Model | Train RMSPE | Hold-out gap | Last quarter of hold-out | Anticipation gap | Post gap | Donor share | Within tolerance |
|---|---|---|---|---|---|---|---|---|
| trips | simplex weights (current design) | 4.4% | -4.0% | -4.7% | -6.8% | -8.5% | 0.12 | no |
| trips | ridge regression | 4.0% | -3.5% | -4.8% | -5.8% | -8.0% | 0.17 | no |
| mean wait (s) | simplex weights (current design) | 4.6% | +1.4% | +1.9% | +2.6% | -0.5% | 0.27 | yes |
| mean wait (s) | ridge regression | 3.3% | +2.6% | +3.1% | +2.9% | +0.9% | 0.12 | no |
| mean base fare ($) | simplex weights (current design) | 3.5% | +0.1% | -0.2% | +3.4% | +2.7% | 0.88 | yes |
| mean base fare ($) | ridge regression | 2.3% | +0.6% | -0.3% | +3.3% | +3.2% | 0.52 | yes |
The prior-year design applied to an untreated window: 314 days from 5 January to 13 November 2024, each compared with the same weekday in 2023 and netted against the donor pool. Nothing changed in policy, so a sound design finds nothing; anything it finds here is also inside its post-period estimate.
| Outcome | 'Effect' on the untreated window | 95% interval |
|---|---|---|
| trips | -5.7% | [-6.3, -5.2] |
| mean wait (s) | +0.4% | [-0.6, +1.3] |
| mean base fare ($) | +3.9% | [+3.4, +4.5] |
| mean driver pay ($) | +0.3% | [-0.2, +0.8] |
| tip rate | +0.9% | [+0.3, +1.4] |
| shared-request share | +2.1% | [-1.0, +5.4] |
The joint test of the clean leads in the event study is reported per outcome and control group in the table above (column "Pre-trend p"). A small p-value means the CBD and the control group were already moving differently before the announcement, after zone and week effects; the dynamic plots show where. Where that happens the fixed-effects estimate should be read with the synthetic control, which re-weights donors to match the CBD's pre-period path.
Static post coefficients when the treatment date is moved to a fake date in 2024 (using only pre-announcement data), and when the treated zones are a random third of the control group (true dates). The share of placebo estimates with p < 0.05 should be near 5%; a higher share means the clustered standard errors understate the noise for that outcome.
Fake treatment dates in 2024 produce significant 'effects' for: trips (vs inner bk queens); mean base fare ($) (vs manhattan north, inner bk queens); mean driver pay ($) (vs manhattan north, inner bk queens); shared-request share (vs manhattan north, inner bk queens). For those outcomes the CBD was already diverging from the control group before the announcement, and the fixed-effects post estimate measures that divergence as much as the policy. Check the out-of-sample and prior-year placebo results below before relying on any design for them.
| Kind | Outcome | Control group | n | Mean estimate | Largest abs | Share p < 0.05 |
|---|---|---|---|---|---|---|
| fake date | trips | inner bk queens | 3 | -0.075 | 0.084 | 100% |
| fake date | trips | manhattan north | 3 | -0.009 | 0.020 | 33% |
| fake date | mean wait (s) | inner bk queens | 3 | +3.270 | 6.750 | 33% |
| fake date | mean wait (s) | manhattan north | 3 | +3.117 | 7.230 | 33% |
| fake date | mean base fare ($) | inner bk queens | 3 | +1.684 | 2.219 | 100% |
| fake date | mean base fare ($) | manhattan north | 3 | +1.475 | 2.003 | 100% |
| fake date | mean driver pay ($) | inner bk queens | 3 | +0.495 | 0.914 | 100% |
| fake date | mean driver pay ($) | manhattan north | 3 | +0.360 | 0.719 | 100% |
| fake date | tip rate | inner bk queens | 3 | +0.000 | 0.001 | 33% |
| fake date | tip rate | manhattan north | 3 | -0.000 | 0.000 | 0% |
| fake date | shared-request share | inner bk queens | 3 | -0.002 | 0.003 | 67% |
| fake date | shared-request share | manhattan north | 3 | -0.002 | 0.003 | 100% |
| fake zones | trips | inner bk queens | 20 | -0.003 | 0.048 | 5% |
| fake zones | trips | manhattan north | 20 | -0.006 | 0.046 | 5% |
| fake zones | mean wait (s) | inner bk queens | 20 | -0.632 | 5.314 | 0% |
| fake zones | mean wait (s) | manhattan north | 20 | -0.013 | 15.490 | 5% |
| fake zones | mean base fare ($) | inner bk queens | 20 | +0.118 | 0.499 | 0% |
| fake zones | mean base fare ($) | manhattan north | 20 | -0.032 | 1.014 | 0% |
| Month | Status | Rows | Failed or warned checks |
|---|---|---|---|
| 2023-01 | pass | 18,479,031 | none |
| 2023-02 | pass | 17,960,971 | none |
| 2023-03 | pass | 20,413,539 | none |
| 2023-04 | pass | 19,144,903 | none |
| 2023-05 | pass | 19,847,676 | none |
| 2023-06 | pass | 19,366,619 | none |
| 2023-07 | pass | 19,132,131 | none |
| 2023-08 | pass | 18,322,150 | none |
| 2023-09 | pass | 19,851,123 | none |
| 2023-10 | pass | 20,186,330 | none |
| 2023-11 | pass | 19,269,250 | none |
| 2023-12 | pass | 20,516,297 | none |
| 2024-01 | pass | 19,663,930 | none |
| 2024-02 | pass | 19,359,148 | none |
| 2024-03 | pass | 21,280,788 | none |
| 2024-04 | pass | 19,733,038 | none |
| 2024-05 | pass | 20,704,538 | none |
| 2024-06 | pass | 20,123,226 | none |
| 2024-07 | pass | 19,182,934 | none |
| 2024-08 | pass | 19,128,392 | none |
| 2024-09 | pass | 19,209,788 | none |
| 2024-10 | pass | 20,028,282 | none |
| 2024-11 | pass | 19,987,533 | none |
| 2024-12 | pass | 21,068,851 | none |
| 2025-01 | pass | 20,405,666 | none |
| 2025-02 | pass | 19,339,461 | none |
| 2025-03 | warn | 20,536,879 | null_rate_band:on_scene_datetime |
| 2025-04 | warn | 19,753,983 | null_rate_band:on_scene_datetime |
| 2025-05 | warn | 21,091,193 | null_rate_band:on_scene_datetime |
| 2025-06 | warn | 19,868,009 | null_rate_band:on_scene_datetime |
| 2025-07 | warn | 19,653,012 | null_rate_band:on_scene_datetime |
| 2025-08 | warn | 19,271,461 | null_rate_band:on_scene_datetime |
| 2025-09 | warn | 19,434,641 | null_rate_band:on_scene_datetime |
| 2025-10 | warn | 21,308,701 | null_rate_band:on_scene_datetime |
| 2025-11 | warn | 20,818,240 | null_rate_band:on_scene_datetime |
| 2025-12 | warn | 22,108,438 | null_rate_band:on_scene_datetime |
| 2026-01 | warn | 20,940,373 | null_rate_band:on_scene_datetime |
| 2026-02 | warn | 19,875,686 | null_rate_band:on_scene_datetime |
| 2026-03 | warn | 22,058,358 | null_rate_band:on_scene_datetime |
| 2026-04 | warn | 20,995,953 | null_rate_band:on_scene_datetime |
| 2026-05 | warn | 22,125,744 | null_rate_band:on_scene_datetime |
| 2026-06 | warn | 20,775,868 | null_rate_band:on_scene_datetime |
| 2026-07 | warn | 20,921,249 | null_rate_band:on_scene_datetime |
| 2026-08 | warn | 20,493,480 | null_rate_band:on_scene_datetime |
No approved release yet; this is the first candidate.
| Field | Value |
|---|---|
| Run id | 20261028T032834Z |
| Git SHA | 32ec535717b79e643d08bb95f5973ae721610814 |
| Manifest hash | d37e7e914398720f4c452eb5c71a44658116880ba69b517a50cc9a9818772976 |
| Package version | 0.1.0 |
| Analysis wall time | 13.6 s |